
(The Defender)
Summary
- Centers for Disease Control and Prevention’s (CDC) Vaccine Adverse Event Reporting System (VAERS) safety signal analysis based on reports from Dec. 14, 2020 – July 29, 2022, for mRNA COVID-19 vaccines shows clear safety signals for death and a range of highly concerning thrombo-embolic, cardiac, neurological, hemorrhagic, hematological, immune-system and menstrual adverse events (AEs) among U.S. adults.
- There were 770 different types of adverse events that showed safety signals in ages 18+, of which more than 500 (or 2/3) had a larger safety signal than myocarditis/pericarditis.
- The CDC analysis shows that the number of serious adverse events reported in less than two years for mRNA COVID-19 vaccines is 5.5 times greater than all serious reports for vaccines given to adults in the U.S. since 2009 (~73,000 vs. ~13,000).
- Twice as many mRNA COVID-19 vaccine reports were classified as serious compared to all other vaccines given to adults (11% vs. 5.5%). This meets the CDC definition of a safety signal.
- There are 96 safety signals for 12-17 year-olds, which include: myocarditis, pericarditis, Bell’s Palsy, genital ulcerations, high blood pressure and heart rate, menstrual irregularities, cardiac valve incompetencies, pulmonary embolism, cardiac arrhythmias, thromboses, pericardial and pleural effusion, appendicitis and perforated appendix, immune thrombocytopenia, chest pain, increased troponin levels, being in intensive care and having anticoagulant therapy.
- There are 66 safety signals for 5-11 year-olds, which include: myocarditis, pericarditis, ventricular dysfunction and cardiac valve incompetencies, pericardial and pleural effusion, chest pain, appendicitis and appendectomies, Kawasaki’s disease, menstrual irregularities, vitiligo and vaccine breakthrough infection.
- The safety signals cannot be dismissed as due to “stimulated,” exaggerated, fraudulent or otherwise artificially inflated reporting, nor can they be dismissed due to the huge number of COVID-19 vaccines administered.
There are several reasons why, but the simplest one is this: the safety signal analysis does not depend on the number of reports, but whether or not some AEs are reported at a higher rate for these vaccines than for other non-COVID vaccines. Other reasons are discussed in the full post below.
- In August 2022, the CDC told The Epoch Times that the results of their safety signal analysis “were generally consistent with EB [Empirical Bayesian] data mining [conducted by the U.S. Food and Drug Administration (FDA)], revealing no additional unexpected safety signals.”
So either the FDA’s data mining was consistent with the CDC’s method — meaning they “generally” found the same large number of highly alarming safety signals — or the signals they did find were expected. Or they were lying. We may never know because the FDA has refused to release their data mining results.
Introduction
Finally! Zachary Stieber at The Epoch Times managed to get the CDC to release the results of its VAERS safety signal monitoring for COVID-19 vaccines, and they paint a very alarming picture.
The analyses cover VAERS reports for mRNA COVID-19 vaccines from the period from the vaccine rollout on Dec. 14, 2020, through to the end of July 2022.
The CDC admitted to only having started its safety signal analysis on March 25, 2022 (coincidentally three days after a lawyer at Children’s Health Defense wrote to them reminding them about our Freedom of Information Act [FOIA] request for it).
Like me, you might be wondering why the CDC waited more than 15 months before doing its first safety signal analysis of VAERS, despite having said in a document posted to its website that it would begin in early 2021 — especially since VAERS is touted as our early warning vaccine safety system.
You might also wonder how they could insist all the while that the COVID-19 vaccines are being subjected to the most rigorous safety monitoring the world has ever known.
I’ll come back to that later. First I’m going to give a little background information on the analysis they did (which you can skip if you’re up to speed) and then describe what they found.
Yep! CDC identified hundreds of safety signals for Pfizer and Moderna COVID vaccines. Bell’s palsy, blood clotting and death were among the signals flagged through analysis of adverse event reports submitted to VAERS.https://t.co/VqDD8746DL
— Robert F. Kennedy Jr (@RobertKennedyJr) January 3, 2023
Background on safety signal analysis
Back in June 2022, the CDC replied to a FOIA request for the safety signal monitoring of the VAERS — the one it had said it was going to do weekly beginning in early 2021.
Their response was: we never did it. Then a little later they said they had been doing it from early on.
But by August 2022, they had finally gotten their story straight, saying that they actually did do it, but only from March 25, 2022, through the end of July. You can get up to speed on that here.
The analysis they were supposed to do uses what’s called proportional reporting ratios (PRRs). This is a type of disproportionality analysis commonly used in pharmacovigilance (meaning the monitoring of adverse events after drugs/vaccines go to market).
The basic idea of disproportionality analysis is to take a new drug and compare it to one or more existing drugs generally considered safe.
We look for disproportionality in the number of adverse events (AEs) reported for a specific AE out of the total number of AEs reported (since we generally don’t know how many people take a given drug).
We then compare to existing drugs considered safe to see if there is a higher proportion of particular adverse events reported for the new drug compared to existing ones. (In this case, they are looking at vaccines, but they still use PRR even though they generally have a much better sense of how many vaccines were administered.)
There are many ways to do disproportionality analysis. The PRR is one of the oldest. Empirical Bayesian data mining, which was supposed to be done on VAERS by the FDA, is another.
The PRR is calculated by taking the number of reports for a given adverse event divided by the total number of events reported for the new vaccine or the total number of reports. It then divides that by the same ratio for one or more existing drugs/vaccines considered safe. Here is a simple formula:
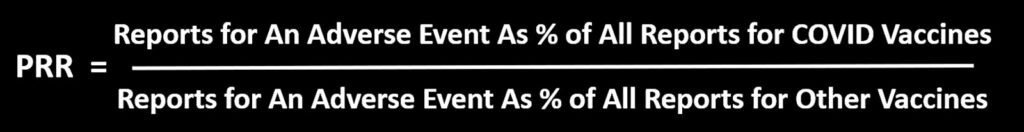
So for example, if half of all adverse events reported for COVID-19 vaccines and the comparator vaccine(s) are for myocarditis, then the PRR is 0.5/0.5 = 1.
If one quarter of all AEs for the comparator vaccine are for myocarditis, then the PRR is 0.5/0.25 = 2.
Traditionally, for a PRR to count as a safety signal, the PRR has to be 2 or greater, have a Chi-square value of 4 or greater (meaning it is statistically significant) and there has to be at least 3 events reported for a given AE. (This also means that if there are tons of different AEs reported for COVID-19 vaccines that have never been reported for any other vaccine, it will not count as a safety signal. I found more than 6,000 of those in my safety signal analysis from 2021.
Of course, a safety signal does not necessarily mean there is a problem or that the vaccine caused the adverse event. But it is supposed to set off alarm bells to prompt closer inspection, as in this CDC pamphlet:
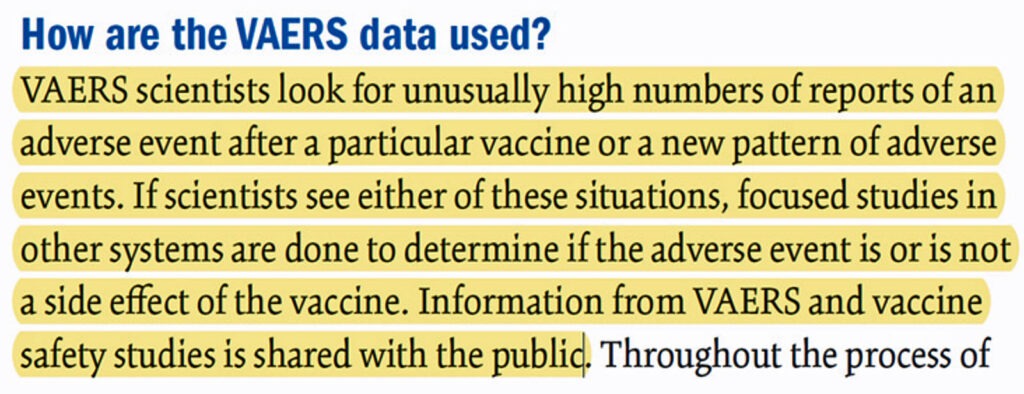 Ah yes, shared with the public — after first refusing to share the results and months of foot-dragging following repeated FOIA requests! We will see that the CDC has not done a more focused study on almost any of adverse events with “new patterns” (AKA safety signals).
So what did the CDC actually do?
The Epoch Times obtained 3 weeks of safety signal analyses from the CDC for VAERS data updated on July 15, 2022 and 29, 2022. Here I will focus on the last one since there is very little difference between them and it is more complete.
The safety signal analysis compares adverse events reported to VAERS for mRNA COVID-19 vaccines from Dec. 14, 2020, through July 29, 2022, to reports for all non-COVID vaccines from Jan. 1, 2009, through July 29, 2022.
[To be precise, the “adverse events” are for “preferred terms” which is a type/level of classification used in the Medical Dictionary for Regulatory Activities, which is the classification system used by VAERS and in other pharmacovigilance systems and clinical research for coding reported adverse events. Not all preferred terms are a symptom or adverse event per se. Some refer to a specific diagnostic test that was done or a treatment that was given.]
PRRs are calculated separately for 5-11 year-olds, 12-15 year-olds and 18+ separately.
For each age group, there are separate tables for AEs from all reports, AEs from reports marked serious and AEs from reports not marked as serious.
[It’s not entirely clear how they divided these up, since there are clearly AEs that should be considered serious that don’t show up in the serious Excel table — though maybe they don’t come up simply because they are looking within serious reports. I believe that they just filtered the reports to include only serious reports or non-serious reports, then did the safety signal analysis on all the AE’s coded in those reports. The reason I think this is that I used the MedAlerts Wayback Machine, selected just the serious COVID-19 vaccine reports, and the numbers of total reports was very close to the one in the table provided by the CDC (MedAlerts actually had a bit less). The files obtained by The Epoch Times do not include much in the way of a description as to how the analyses were done, so I had to infer some details, which might be incorrect. I will try to note when I am drawing an inference about how the analysis was done.]
Recall that a serious report is one that involves death, a life-threatening event, new or prolonged hospitalization, disability or permanent damage, or a congenital anomaly. I will focus on the reports for all AE’s.
They also have a table that calculates PRRs by comparing reports for the Pfizer COVID-19 vaccine to reports for the Moderna vaccine and vice versa, again for all reports, serious reports only and non-serious reports. There were no remarkable findings in those tables, so I will not discuss them.
This isn’t that surprising since both vaccines are very similar and so should present relatively similar adverse events when compared to each other, and any differences are likely not large enough to be picked up by a PRR analysis.
The CDC seems to have calculated PRRs for every different type of adverse event reported for all the COVID-19 vaccines examined — though it’s possible they only analyzed a subset. What seems clear is that among the AEs they examined, the only ones included in the tables satisfy at least one of two conditions: a PRR value of at least 2 and a Chi-square value of at least 4 (Chi is the Greek letter χ and is pronounced like ‘kai’).
When both conditions were met, they highlighted the adverse event in yellow, which appears to indicate a safety signal. There were no COVID-19 vaccine AEs listed with fewer than 3 reported events, though for non-COVID vaccines there were many AEs listed that had only 1 or 2 reported since 2009.
The CDC tables still include these and highlight them in yellow when the PRR is greater than 2 and the Chi-square value is great than 4, indicating these events are counted as safety signals.
What safety signals did the CDC find?
I’m going to divide this up by age groups and the Pfizer v. Moderna comparison. Let’s start with the 18+ group.
There are 772 AEs that appear on the list. Of these, 770 are marked in yellow and have PRR and Chi-square values that qualify them as safety signals. Some of these are new COVID-19-related codes, and we would expect those to trigger a signal since they didn’t exist in prior years to be reported by other vaccines.
So if we take those off, we are left with 758 different types of non-COVID adverse events that showed safety signals.
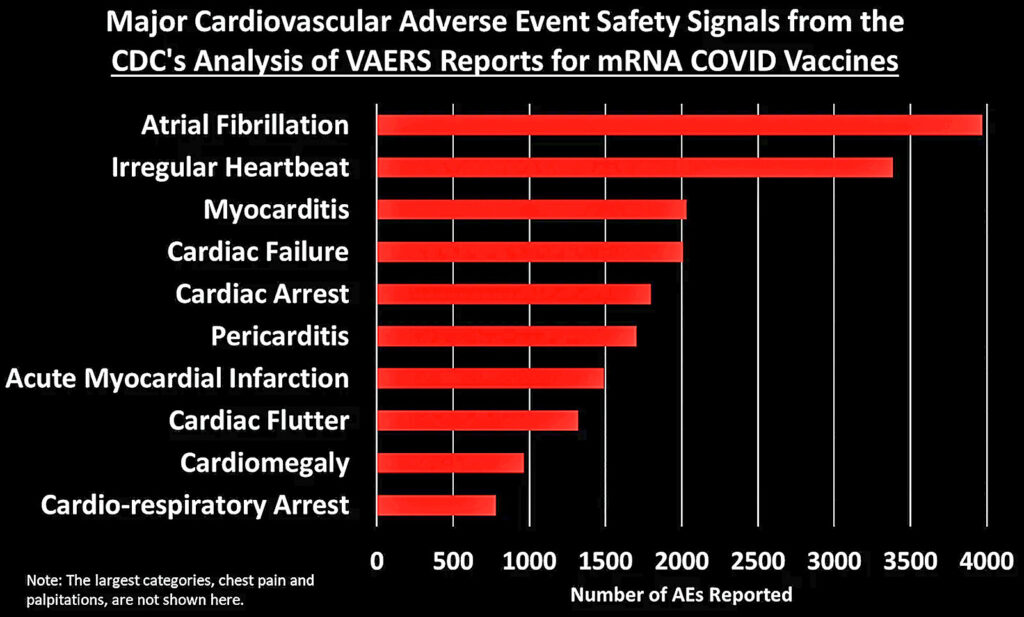
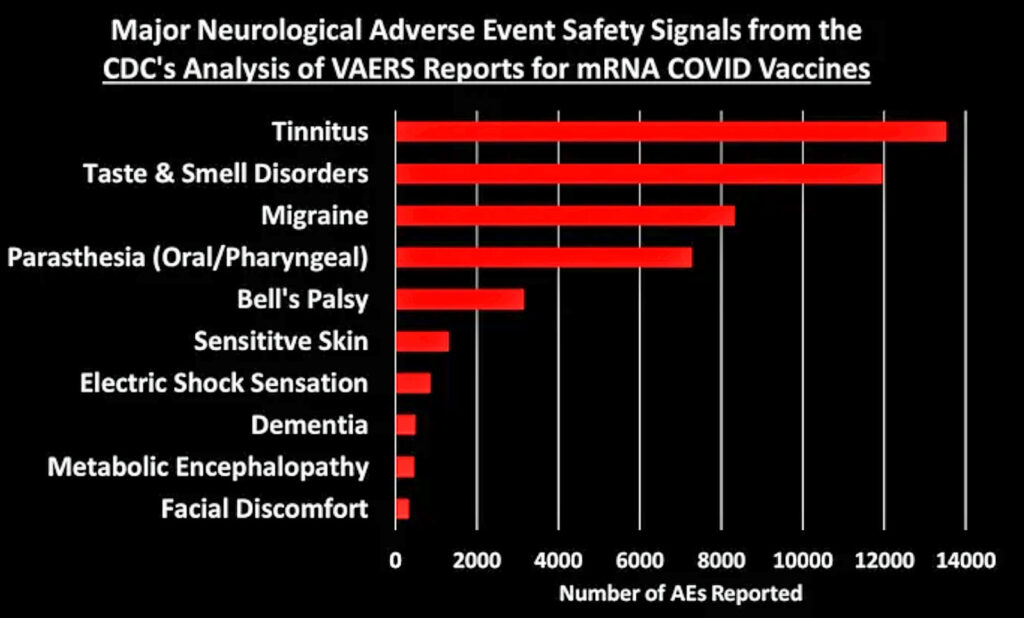
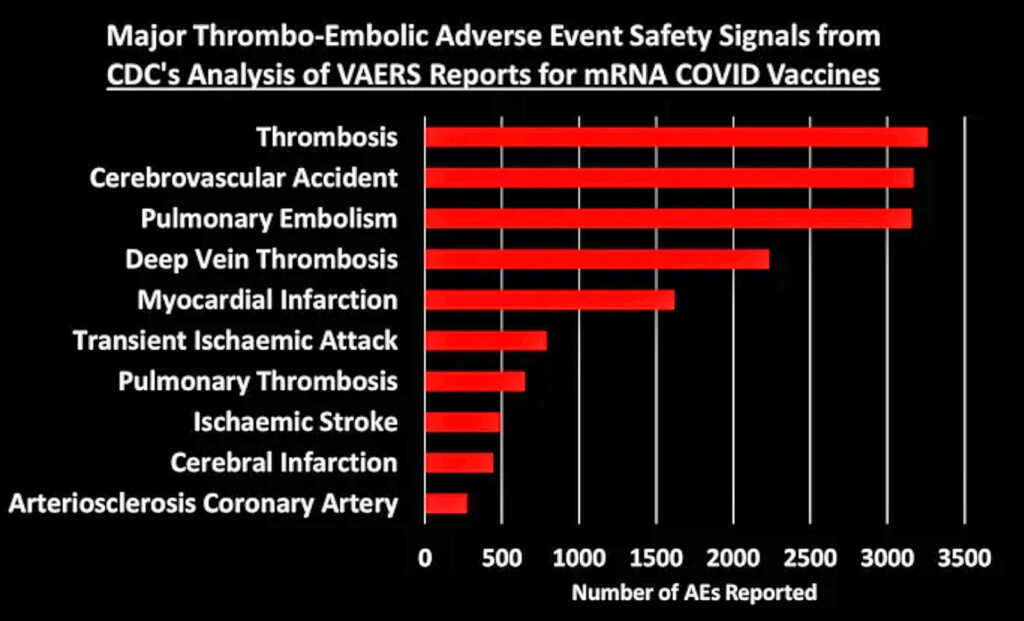
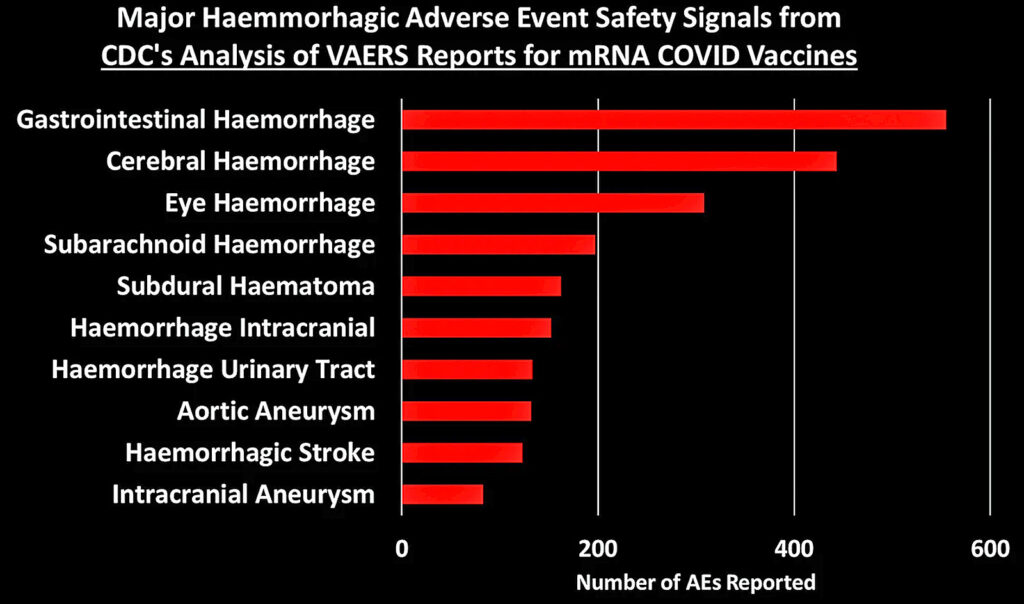
I grouped these 758 safety signals into different categories. The figure below shows the total number of AEs reported for each of the major categories of safety signals:
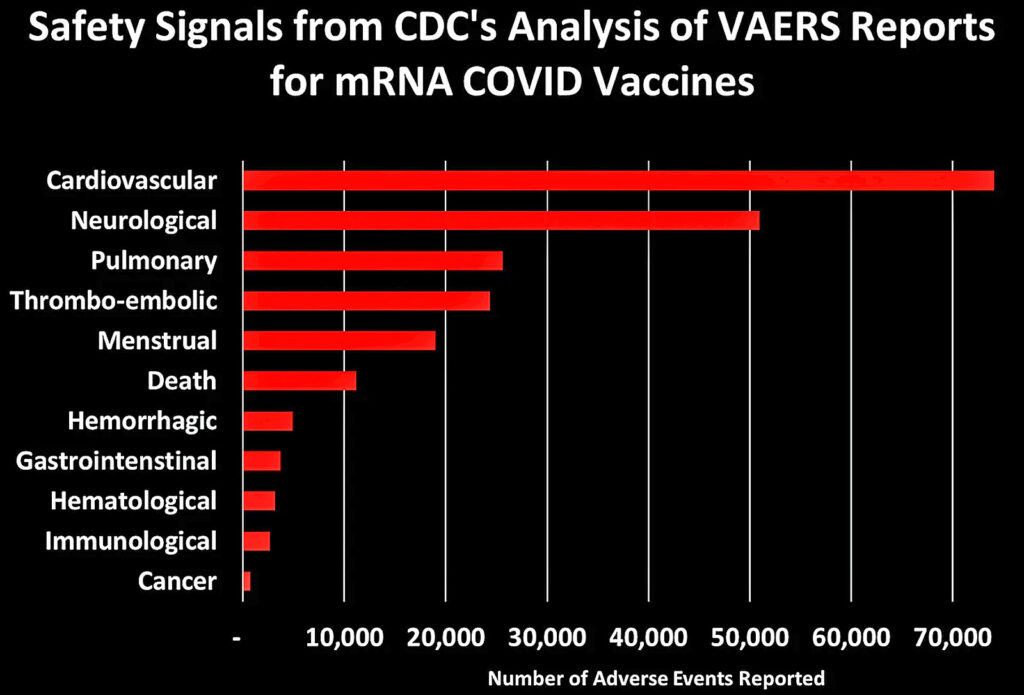
Let’s dig into some of these categories to look at what types of AEs generated the most number of reports:
[Generally speaking, these figures show the top 10 AEs in each category. In some cases I combined AEs that indicated the same thing, such as combining “heart rate irregular” with “arrythmia.”]

You can peruse the adverse events using the Excel tables provided by the CDC, which were posted by The Epoch Times and Children’s Health Defense at the links at the top of this post.